Today the Argentine government announced that any Argentine using a credit card to buy stuff outside the country will have to pay an additional 15% when they pay their bill in pesos, although they can apply this amount to what they may owe in income taxes. This is nothing other than a flimsy attempt to disguise what is a 15% devaluation of the peso.
Those familiar with the goings-on in Argentina know that since last October, the government has been trying desperately to restrict the ability of its citizens to exchange pesos for dollars, because dollars have been in short supply. Imports have been strictly limited, and those traveling abroad must do the impossible to justify their right to buy dollars to pay for their expenses. But one big loophole remained: those with credit cards could continue to buy things overseas and pay for those purchases at the official rate. Now that loophole has been partially closed.
We have some good friends from Argentina staying with us right now, and they were dismayed (to put it mildly) to find out tonight that, starting September 1st, their expenses, if paid by credit card, will suddenly cost them 15% more.
At this point it is practically inevitable that Argentina will eventually declare a major devaluation of the peso. It will probably be at least 40% if not more. As of a few days ago, the "parallel" rate for the dollar was about 6.5, whereas the official rate was 4.6. In other words, the market has been expecting a 40% devaluation. After today's announcement, the parallel rate will undoubtedly rise even more.
When the government restricts people's ability to buy something—in this case dollars—that almost guarantees that the price of that prohibited thing will rise. If Argentines are not free to exchange their pesos for dollars, they will pay almost any price to do so. A currency which is not freely convertible soon becomes worthless. Unfortunately, I have seen this play out so many times in Argentina that I'm amazed that there are still 40-some million people in the country who are willing to suffer under their miserable excuse for a government.
If you want a good reason why the dollar is still so much in demand, this is one. The Fed may be acting irresponsibly, and our government may be spending irresponsibly, but things are not as bad here as they are in Argentina.
Jumat, 31 Agustus 2012
Kamis, 30 Agustus 2012
Quick updates

Unemployment claims haven't budged this year—they've averaged 374K per week, and that's the latest figure as well. So although the economy is not improving meaningfully, neither is it deteriorating. But there are improvements on the margin, as shown in the chart above. The number of people receiving unemployment insurance has dropped 18.5% relative to a year ago, and that represents 1.2 million people who are either now working or who have an increased incentive to find and accept a new job.

Those who are working are seeing ongoing increases in their real incomes. Even though there are 5 million fewer jobs today than at the peak in early 2008, real incomes have reached a new high. Real incomes have risen at a 3.6% annualized pace over the past six months, and reeal disposable income is up 2% over the past year. None of this is anything to write home about, but it is still progress.
The economy continues to grow at a modest pace.
Paul Ryan knocks it out of the park
This man is a breath of fresh air: sincere, honest, and principled. He wants to fix the mess we're in, and he knows how and why. I'll let him speak for himself—here's my selection of his best lines tonight:
Maybe the greatest waste of all was time. Here we were, faced with a massive job crisis - so deep that if everyone out of work stood in single file, that unemployment line would stretch the length of the entire American continent. You would think that any president, whatever his party, would make job creation, and nothing else, his first order of economic business. But this president didn't do that. Instead, we got a long, divisive, all-or-nothing attempt to put the federal government in charge of health care.
Obamacare comes to more than two thousand pages of rules, mandates, taxes, fees, and fines that have no place in a free country.
After four years of government trying to divide up the wealth, we will get America creating wealth again. With tax fairness and regulatory reform, we'll put government back on the side of the men and women who create jobs, and the men and women who need jobs.
The choice is whether to put hard limits on economic growth, or hard limits on the size of government, and we choose to limit government.
College graduates should not have to live out their 20s in their childhood bedrooms, staring up at fading Obama posters and wondering when they can move out and get going with life.If a man like Paul Ryan can't fix what ails this country, then all hope is lost. Ryan knows where we have to go, and Mitt Romney has a proven record of doing what needs to be done to get there. Together they are, in my opinion, the best hope we have for a better future.
Rabu, 29 Agustus 2012
Jackson Hole thoughts
Here are some things that Fed Chairman Bernanke should be considering as he prepares to give his talk later this week in Jackson Hole.

Inflation expectations are rising. This chart shows the Fed's favorite forward-looking indicator of the market's inflation expectations (the 5-yr, 5-yr forward expected inflation rate embedded in TIPS and Treasury prices). In September of last year, this measure of inflation expectations was a relatively mild 2.0%. Today, it has climbed to almost 2.8%. This is by no means a big concern, since 2.8% inflation is only slightly more than the 2.4% annualized increase in the CPI over the last 10 years. But it does show the bond market is becoming a bit uneasy about the prospects for future inflation. More Fed ease at this point would be hard to justify.

The dollar is weak vis a vis other currencies. This chart shows the Fed's calculation of the dollar's inflation-adjusted value relative to a large basket of trade-weighted currencies and a smaller basket of major currencies. No matter how you look at it, the dollar is trading only slightly higher than it's all-time lows. More Fed ease could weaken the dollar further, and a weak currency tends to exacerbate inflationary pressures.


There is no shortage of money. The M2 measure of money is growing above its long-term, 6% annualized growth rate. Most of the extra growth has come from savings deposits, which now total $6.4 trillion, up from $4 trillion four years ago. For now, it's obvious that there is a tremendous demand for safe dollar liquidity, but should this change, a flood of money could be released from savings deposits into the economy in the form of extra spending. And of course, the Fed has already been extraordinarily generous in its provision of reserves to the banking system. For now that appears to have been justified by the world's voracious demand for dollar liquidity and safe dollar assets (bank reserves now function as a close substitute for 3-mo. T-bills). But that could change, and if the Fed fails to withdraw the reserves in timely fashion, it could support a massive amount of new money creation.

The economy is still growing, albeit at a modest pace. Since the recovery began three years ago, nominal growth has averaged about 4% a year. It dipped only slightly from that level in the past year. Real growth has averaged about 2%, and it too dipped only slightly in the past year. Jobs continue to expand, and new claims for unemployment are relatively low and stable. Thus, there are no signs that growth is slowing further.
UPDATE: In view of the above, it is not surprising that, while Bernanke left the door open to further easing measures in his Jackson Hole speech today, he made no promises. If the economy deteriorates then the Fed will do something. But for now, there is no sign of deterioration, just disappointingly slow growth. As Bernanke also said, it's the turn of fiscal policy to make a difference.

Inflation expectations are rising. This chart shows the Fed's favorite forward-looking indicator of the market's inflation expectations (the 5-yr, 5-yr forward expected inflation rate embedded in TIPS and Treasury prices). In September of last year, this measure of inflation expectations was a relatively mild 2.0%. Today, it has climbed to almost 2.8%. This is by no means a big concern, since 2.8% inflation is only slightly more than the 2.4% annualized increase in the CPI over the last 10 years. But it does show the bond market is becoming a bit uneasy about the prospects for future inflation. More Fed ease at this point would be hard to justify.
The dollar is weak vis a vis other currencies. This chart shows the Fed's calculation of the dollar's inflation-adjusted value relative to a large basket of trade-weighted currencies and a smaller basket of major currencies. No matter how you look at it, the dollar is trading only slightly higher than it's all-time lows. More Fed ease could weaken the dollar further, and a weak currency tends to exacerbate inflationary pressures.
There is no shortage of money. The M2 measure of money is growing above its long-term, 6% annualized growth rate. Most of the extra growth has come from savings deposits, which now total $6.4 trillion, up from $4 trillion four years ago. For now, it's obvious that there is a tremendous demand for safe dollar liquidity, but should this change, a flood of money could be released from savings deposits into the economy in the form of extra spending. And of course, the Fed has already been extraordinarily generous in its provision of reserves to the banking system. For now that appears to have been justified by the world's voracious demand for dollar liquidity and safe dollar assets (bank reserves now function as a close substitute for 3-mo. T-bills). But that could change, and if the Fed fails to withdraw the reserves in timely fashion, it could support a massive amount of new money creation.
The economy is still growing, albeit at a modest pace. Since the recovery began three years ago, nominal growth has averaged about 4% a year. It dipped only slightly from that level in the past year. Real growth has averaged about 2%, and it too dipped only slightly in the past year. Jobs continue to expand, and new claims for unemployment are relatively low and stable. Thus, there are no signs that growth is slowing further.
UPDATE: In view of the above, it is not surprising that, while Bernanke left the door open to further easing measures in his Jackson Hole speech today, he made no promises. If the economy deteriorates then the Fed will do something. But for now, there is no sign of deterioration, just disappointingly slow growth. As Bernanke also said, it's the turn of fiscal policy to make a difference.
Selasa, 28 Agustus 2012
Global recovery perspective

Despite all the continuing problems in the Eurozone (the Euro Stoxx index is only up 38% from its recession lows, as compared to the 111% gain of the S&P 500), and the slowdown in China (the Shanghai Composite index is only up 25% from its October '08 lows), the global equity market has posted a 92% gain since early March '09, according to Bloomberg. We are still 20% below the 2007 highs, so it's still far from a complete recovery, but it's not unimpressive: global equity markets have recovered $23.6 trillion of their 2008-9 losses.
Consumer confidence remains very low

The Conference Board's measure of consumer confidence in August was weaker than expected (60.6 vs. 66). As the charts above and below show, although confidence is up from the all-time lows of the last recession, it is very close to the lows associated with every other recession in the past 45 years. This is a reminder that pessimism still rules. The best way to interpret the rally in equities in the past 3+ years is to see it not as a return of optimism, but rather as a grudging acknowledgement that things haven't turned out as bad as expected.

Still more signs of a housing bottom

The evidence continues to mount in support of the theory that we have seen the bottom not only in residential construction (up 44% since Feb. '11) but also in housing prices, as the chart above shows. Both the Case Shiller and the Radar Logic indices of housing prices are up in the year ending last June (+0.5% and +2.8%, respectively). Moreover, the Case Shiller index for this past June was almost identical to its level in June, 2009. The housing market has now suffered through almost seven years of the most wrenching adjustment imaginable, with prices and construction plunging over a four-year period and then consolidating over the past three years. That's plenty of time to work off a considerable amount of excess inventory and to reprice homes to appeal to new buyers.
Mark Perry has some interesting stats on how impressive the recent numbers have been here.
There are still many millions of homeowners who are underwater, and millions of foreclosed properties yet to be sold, but the dynamics of the housing market are changing. In the past year or so, we've passed through an inflection point in which conditions have shifted from a buyer's market to a seller's market. Now, thanks to incredibly low mortgage rates, housing prices are more affordable than ever before. The psychology of the marginal buyer is slowly beginning to shift: can he or she can snag that home for less if they continue to wait, or is it better to offer full price right now? There is already plenty of anecdotal evidence of bidding wars in some areas, and that could spread to more markets over the next year.

UPDATE: The purpose of this last chart is to illustrate how home prices have come back into line with rents, further bolstering the view that market forces have moved the housing market back into a sort of equilibrium.
Senin, 27 Agustus 2012
The myth of the "balanced approach" to fiscal policy
Glenn Hubbard and Tim Kane recently launched a new blog, "Balance: Why Great Powers Lose It and How America Can Regain It," that looks very promising. Here's an excerpt from their opening essay:

... we have two political parties and two approaches to the trillion-dollar budget deficit. The liberal approach is to raise taxes and the conservative approach is to slow the growth of government expenditures.
A smarter concept of fiscal policy balance is one that prioritizes outcomes (more jobs, faster growth, less poverty) over inputs. The goal of good fiscal policy is less about equating revenue with outlays and more about the fiscal mix which optimizes long-term prosperity. The fact that the liberal “War on Poverty” launched half a century ago has failed to make a dent in poverty is a sign of the government’s imbalanced thinking. Balance means putting incentives for job creation first, not good intentions to alleviate suffering.This growth-oriented approach makes a lot of sense, and we can already see how. As the chart below shows, tax revenues have been rising for more than two years, without any increase in tax rates, and even though this recovery has been the weakest on record; revenues are up because more people are working, incomes are rising, and corporate profits are strong. Revenues always rise in a recovery, and the stronger the recovery, the more they rise. Meanwhile, federal spending has been almost flat since the recession ended, thanks largely to Congressional gridlock. (Though this happy combination is not likely to persist much longer if entitlement programs are not cut back.) For now, the result is a welcome decline in the deficit as a percent of GDP, from a high of 10.5% at the end of 2009, to 8.5% today. We have also seen a welcome decline in spending as a percent of GDP, from a high of 25.2% in Q3/09 to 23.5% today. Much more remains to be done, but it is not impossible at all.
Jumat, 24 Agustus 2012
Eurozone improvements

Eurozone 2-yr swap spreads have plunged by 65 bps so far this year, and are now almost back to the levels that preceded last year's flare-up of Eurozone default worries. This tells us that the ECB has been successful in its attempts to inject needed liquidity to the financial system. The risk of major bank defaults has been sharply reduced, and that in turn brightens the outlook for the Eurozone economy. Problems still exist, of course, but the atmosphere of crisis and panic has all but disappeared. Liquid markets have an amazing ability to sort out problems, by allowing participants to distribute risk to those more willing and able to bear the risk.

5-yr credit default swaps are an excellent indicator of the credit risk of major borrowers. As this chart shows, default risk has dropped considerably over the past year. Spain, Ireland, and Italy are now considered to be better credits than the average junk bond. They are still risky, of course, but at these levels the risks are manageable and attractive to many institutional investors hungry for yields.
The best personal computer in the world
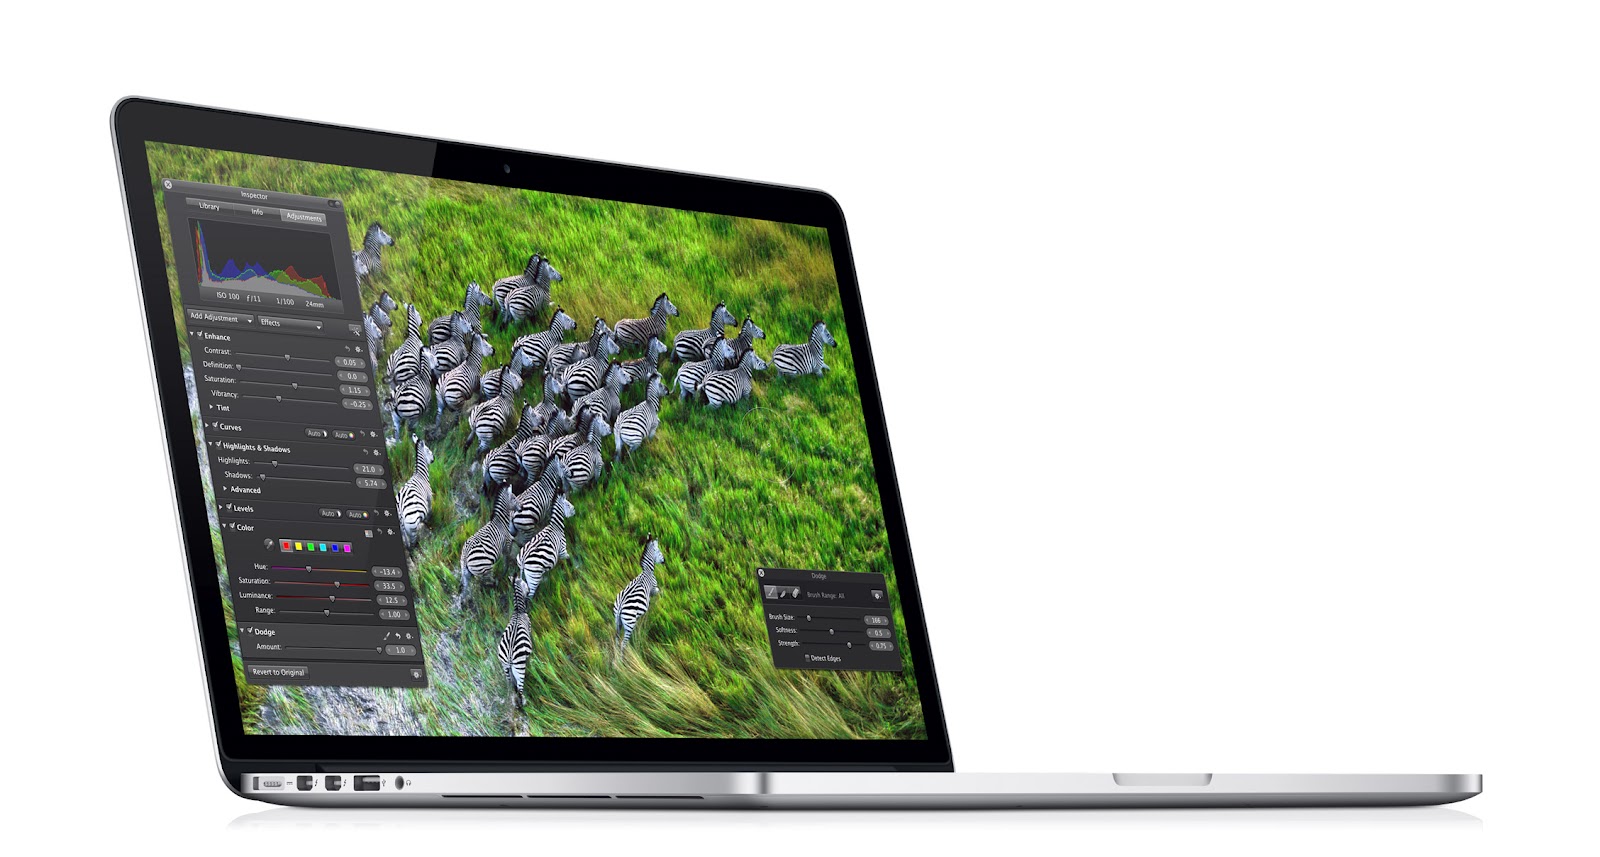
This is my new MacBook Pro with Retina Display. I'm showing it off because it is without a doubt the best personal computer in the world right now. Lightning fast processor, solid state drive, gorgeous design, highest-quality build, and about one-third lighter than its predecessor. But what sets it apart from all the others is the display. It's like looking at a high-quality magazine with a page that's more than twice the size of the new iPad: type is crystal clear, and photos are as good as the best printer could ever deliver. You can't see the pixels: looking at any other screen, everything looks blurry.
After taking it out of the box it took me about 3 minutes to set up, and then an hour and a half to transfer 175 GB of files from my old MacBook Pro. Once the transfer finished, all my applications and files were just where they should be, and everything worked just fine.
Specifications:
2.6GHz quad-core Intel Core i7
Turbo Boost up to 3.6GHz
8GB 1600MHz memory
512GB flash storage
Intel HD Graphics 4000
NVIDIA GeForce GT 650M with 1GB of GDDR5 memory
Built-in battery (7 hours)
Weight: 2 kg
Retina display; 15.4-inch (diagonal) LED-backlit display with IPS technology; 2880-by-1800 resolution at 220 pixels per inchSome will say that its $2800 price tag is outrageously expensive. I think it's staggerlingly cheap, since I remember my very first Mac, which I bought in 1987. It too cost about $2800, but it had a very tiny black and white screen, only 1 MB of RAM, and only 20 MB of hard drive storage. Back then a computer like this one would have been impossible to even contemplate, and you couldn't create it for all the money in the world. Everything is relative, of course, and today there are plenty of cheaper laptops that get the job done. But this one does just about anything you can imagine (even running Windows programs alongside Mac programs) in grand style. Some day all computers will have displays like this—we've been waiting decades for them, and they're finally here.
Kamis, 23 Agustus 2012
TIPS update: very weak growth, higher inflation
Time to check in on the TIPS market to see what it is telling us. By looking at the assumptions embedded in TIPS and Treasury yields, we see that the market is expecting exceptionally weak growth and/or recession for the next several years, but also higher inflation than we have currently. This is a rather amazing development, since the bond market traditionally has tended to associate weak growth with low and/or falling inflation. This tells me that the bond market is correctly evaluating the consequences of today's expansive monetary policy and oppressive fiscal policy.

To begin with, the real yield on TIPS today is very close to an all-time low. In fact, real yields on TIPS are negative all the way out to 15 years' maturity. The chart above shows the real yield on 10-yr TIPS, and I have overlaid my view of how attractive or unattractive real yields happen to be. With real yields as low as they are today, investors in most TIPS are guaranteed by the US government to lose some portion of their purchasing power every year. Looked at another way, with yields super-low, prices are super-high, and that implies very strong demand for TIPS. And very strong demand for something means that it is not very attractive from an investor's point of view.

This chart compares the real yield on 10-yr TIPS to the nominal yield on 10-yr Treasuries. The difference between the two is the market's "break-even" or implied annual inflation rate over the next 10 years. Here we see that both TIPS and Treasuries enjoy exceptionally strong demand, because their yields are both very close to all-time lows. However, the market's expected rate of inflation is about average: 2.3% for the next 10 years, which is only slightly less than the 2.4% annualized CPI over the past 10 years. From this we can deduce that although TIPS are very expensive—trading very close to all-time high prices—it's not because investors fear inflation. Inflation expectations today are quite normal.

With this next chart I try to show how the real yield on 5-yr TIPS tends to track the economy's real growth rate over time. In the late 1990s, economic growth rates were very strong, and TIPS yields were extraordinarily high. That made perfect sense, because the real yield on TIPS had to be competitive with the real return on other securities, and other securities were delivering fabulous real returns because the economy was so strong. Today it's just the opposite. Real yields are low because the market expects economic growth to be very weak; as this chart suggests, the real growth expectations driving 5-yr TIPS are likely somewhere in the neighborhood of 0-1% on average over the next 5 years. There is so much fear about the future out there in the market that investors are happy to lock in a guaranteed loss of purchasing power with TIPS because they believe that the return on alternative investments will be much worse, and that is what one would expect if the economy were indeed to grow less than 1% per year over the next five years.

This next chart shows my calculation of the 5-yr, 5-yr forward expected inflation rate embedded in TIPS and Treasury prices (Bloomberg's calculation of this rate today is 2.74%, mine is 2.67%). Think of this as what the market's 5-yr inflation expectations will be, five years from now. Since the 10-yr expected rate is 2.3% and the expectation for the second half of the next 10 years is 2.7%, that means the market expects inflation to average just under 2.0% over next five years.
Contrast the situation today (super-low real and nominal yields) with conditions at the end of 2008 (low nominal yields, relatively high real yields). Back then, the market feared deflation more than anything else (the 5-yr, 5-yr forward expected inflation rate was less than 0.5%), and demand for TIPS was very weak. But today, the market fears very weak growth more than anything else, which is why both TIPS and Treasury yields are extremely low. On the margin, the market has been worrying more and more, over most of the past year, that inflation could creep up at some point in the future, even as the market has been worrying that the economy will be weaker.
To be in a situation where market expectations call for very weak growth for as far as the eye can see, while at the same time expecting somewhat higher inflation is remarkable, because it refutes the traditional Phillips Curve mentality that says inflation goes up only when the economy is very strong, and goes down when it is very weak. This is one more blow to Keynesian-type thinking, and I say good riddance.
In my view, the bond market is correctly evaluating the implications of today's very accommodative monetary policy coupled with today's very oppressive fiscal policy, and concluding that on the present track, we are heading towards a very weak economy with somewhat higher inflation.
Just because the deficit is still huge as a percent of GDP does not mean fiscal policy is expansionary. On the contrary, as Milton Friedman always taught us, it is the level of government spending more than anything else that is the important fiscal variable to watch. Whether a given level of spending is financed by borrowing or by taxes is not as important as whether the government is commandeering too much of the economy's resources. With federal spending currently running about 23.5% of GDP (12% higher than the 40-year average of 20.9%), I think spending (the bulk of which is transfer payments from the most productive members of society to the less productive) is too high and it is acting as a headwind to the economy's ability to grow. The government is wasting a significant portion of the economy's resources that could be better utilized by the private sector, in addition to creating perverse incentives.
All of the above adds up to one more reason why I continue to insist that the market is priced to very pessimistic assumptions, e.g., the Fed is going to make an inflationary mistake and there is very little chance that our bloated federal government will become less oppressive. If you agree with the market, then you stay in cash on the sidelines, and/or you buy TIPS and Treasuries in case things turn out to be even worse. If you think there is a chance that things could improve even just a little bit, then you avoid cash, Treasuries, and TIPS, and you invest in just about anything else: stocks, corporate bonds, and real estate. I exclude gold and commodities from this list, because I think they are priced to a very big inflationary mistake on the part of the Fed. If the Fed manages to keep inflation below 3-4% for the foreseeable future, then I would expect to see gold prices decline significantly, and that would imply very little, if any, upside potential for commodities.
To begin with, the real yield on TIPS today is very close to an all-time low. In fact, real yields on TIPS are negative all the way out to 15 years' maturity. The chart above shows the real yield on 10-yr TIPS, and I have overlaid my view of how attractive or unattractive real yields happen to be. With real yields as low as they are today, investors in most TIPS are guaranteed by the US government to lose some portion of their purchasing power every year. Looked at another way, with yields super-low, prices are super-high, and that implies very strong demand for TIPS. And very strong demand for something means that it is not very attractive from an investor's point of view.
This chart compares the real yield on 10-yr TIPS to the nominal yield on 10-yr Treasuries. The difference between the two is the market's "break-even" or implied annual inflation rate over the next 10 years. Here we see that both TIPS and Treasuries enjoy exceptionally strong demand, because their yields are both very close to all-time lows. However, the market's expected rate of inflation is about average: 2.3% for the next 10 years, which is only slightly less than the 2.4% annualized CPI over the past 10 years. From this we can deduce that although TIPS are very expensive—trading very close to all-time high prices—it's not because investors fear inflation. Inflation expectations today are quite normal.
With this next chart I try to show how the real yield on 5-yr TIPS tends to track the economy's real growth rate over time. In the late 1990s, economic growth rates were very strong, and TIPS yields were extraordinarily high. That made perfect sense, because the real yield on TIPS had to be competitive with the real return on other securities, and other securities were delivering fabulous real returns because the economy was so strong. Today it's just the opposite. Real yields are low because the market expects economic growth to be very weak; as this chart suggests, the real growth expectations driving 5-yr TIPS are likely somewhere in the neighborhood of 0-1% on average over the next 5 years. There is so much fear about the future out there in the market that investors are happy to lock in a guaranteed loss of purchasing power with TIPS because they believe that the return on alternative investments will be much worse, and that is what one would expect if the economy were indeed to grow less than 1% per year over the next five years.
This next chart shows my calculation of the 5-yr, 5-yr forward expected inflation rate embedded in TIPS and Treasury prices (Bloomberg's calculation of this rate today is 2.74%, mine is 2.67%). Think of this as what the market's 5-yr inflation expectations will be, five years from now. Since the 10-yr expected rate is 2.3% and the expectation for the second half of the next 10 years is 2.7%, that means the market expects inflation to average just under 2.0% over next five years.
Contrast the situation today (super-low real and nominal yields) with conditions at the end of 2008 (low nominal yields, relatively high real yields). Back then, the market feared deflation more than anything else (the 5-yr, 5-yr forward expected inflation rate was less than 0.5%), and demand for TIPS was very weak. But today, the market fears very weak growth more than anything else, which is why both TIPS and Treasury yields are extremely low. On the margin, the market has been worrying more and more, over most of the past year, that inflation could creep up at some point in the future, even as the market has been worrying that the economy will be weaker.
To be in a situation where market expectations call for very weak growth for as far as the eye can see, while at the same time expecting somewhat higher inflation is remarkable, because it refutes the traditional Phillips Curve mentality that says inflation goes up only when the economy is very strong, and goes down when it is very weak. This is one more blow to Keynesian-type thinking, and I say good riddance.
In my view, the bond market is correctly evaluating the implications of today's very accommodative monetary policy coupled with today's very oppressive fiscal policy, and concluding that on the present track, we are heading towards a very weak economy with somewhat higher inflation.
Just because the deficit is still huge as a percent of GDP does not mean fiscal policy is expansionary. On the contrary, as Milton Friedman always taught us, it is the level of government spending more than anything else that is the important fiscal variable to watch. Whether a given level of spending is financed by borrowing or by taxes is not as important as whether the government is commandeering too much of the economy's resources. With federal spending currently running about 23.5% of GDP (12% higher than the 40-year average of 20.9%), I think spending (the bulk of which is transfer payments from the most productive members of society to the less productive) is too high and it is acting as a headwind to the economy's ability to grow. The government is wasting a significant portion of the economy's resources that could be better utilized by the private sector, in addition to creating perverse incentives.
All of the above adds up to one more reason why I continue to insist that the market is priced to very pessimistic assumptions, e.g., the Fed is going to make an inflationary mistake and there is very little chance that our bloated federal government will become less oppressive. If you agree with the market, then you stay in cash on the sidelines, and/or you buy TIPS and Treasuries in case things turn out to be even worse. If you think there is a chance that things could improve even just a little bit, then you avoid cash, Treasuries, and TIPS, and you invest in just about anything else: stocks, corporate bonds, and real estate. I exclude gold and commodities from this list, because I think they are priced to a very big inflationary mistake on the part of the Fed. If the Fed manages to keep inflation below 3-4% for the foreseeable future, then I would expect to see gold prices decline significantly, and that would imply very little, if any, upside potential for commodities.
More evidence of a housing recovery

Sales of new homes in July were a bit stronger than expected (373K vs. 365K), and they were up 36% from last year's low. That's pretty impressive, even if the current sales rate is still miserably slow. The signs on the margin of genuine improvement in the housing market abound. After 6 years of a wrenching adjustment, this market is back on its feet and improving.
Claims data shows no sign of recession


Real-time, market-driven data such as Treasury yields and swap spreads are arguably the best things to watch for clues to the economy's health; they can't be manipulated, they embody the collective wisdom of millions of market participants, they aren't subject to faulty seasonal adjustment, and they are never revised after the fact. The next best thing are weekly statistics (high-frequency data), with initial claims for unemployment being arguably the best. Claims data comes with a 1-2 week lag, and sometimes is subject to faulty seasonal adjustment, so it's not perfect, but it is very timely compared to many other statistics.
As these two charts show, as of a week ago there was no sign whatsoever of any deterioration in the labor market. On an adjusted basis, weekly claims have been relatively flat so far this year; on an unadjusted basis, claims last week were 10% below their year-ago level. If the economy were healthier, claims would be lower—we would be seeing numbers in the 300-350 range, instead of the 350-390 range that has prevailed this year. But that's not a huge difference. If the economy were tipping into recession, we would be seeing claims rising, but that's not the case at all.
Meanwhile, the number of people receiving unemployment insurance benefits continues to decline: down 17% in the past year, or 1.1 million fewer people. This means that there is an ongoing improvement in the incentives that the unemployed have to find and accept jobs. Unemployment insurance is a nice "safety net," but the truth is that getting a weekly check for not working reduces one's incentive to find another job, especially if the new job pays less than the old job. Unfortunately, recessions happen when the economy's resources are no longer being efficiently utilized—when resources such as labor have to be shifted from one are to another, or adjust to new pricing realities. In short, unemployment claims retard the recovery process because people naturally resist taking a new job for less pay than they received before. So it's good to see the ongoing decline in the number of people receiving claims.
Claims data shows no sign of recession and is consistent with an economy that continues to grow, albeit slowly.
Rabu, 22 Agustus 2012
Why a QE3 won't be good for bonds
Today the bond market got excited because the minutes of the July FOMC meeting reflected strong support for another round of Quantitative Easing should the economy fail to improve. 10-yr Treasury yields fell over 10 bps on the day, in apparent anticipation of more Fed purchases of Treasuries. This type of knee-jerk reaction is bound to end in tears, however.

As the above chart of 10-yr Treasury yields shows, the bond market's enthusiasm for past episodes of quantitative easing was short-lived. The first phase of QE1 was announced Nov. 25, 2008, and it consisted of up to $100 billion in Agency securities and $500 billion of MBS. In the early stages of QE1, 10-yr yields declined almost 100 bps, but only for 5-6 weeks. (I think Fed purchases were overwhelmed by the widespread fears of a global financial collapse.) By late January, when the Fed announced the purchase of more Agency and MBS debt, and the expectation of the purchase of long-term Treasuries, yields had jumped back up. On March 18, 2009, the FOMC formally announced the expansion of the program to total $1.25 trillion of MBS and $300 billion of longer-term Treasuries. Despite these massive and unprecedented purchases, 10-yr Treasury yields marched steadily higher, and didn't peak until the end of QE1 in late March, 2010. Yes, that's right: yields rose until the time the Fed stopped purchasing bonds.
The idea of QE2 was first floated by Bernanke in late August 2010, when 10-yr yields were around 2.65%. By the time QE 2 became official, with the FOMC announcement of Novermber 3, 2010, 10-yr yields had fallen by a about 15 bps, to 2.5%. As QE 2 was implemented over the next six months, with the Fed purchasing an additional $600 billion of Treasuries, not only did yields fail to decline, they actually rose by 100 bps.
In short, the anticipation and the reality of two major rounds of Fed purchases of MBS and Treasuries only served to depress yields temporarily. The major impact of QE1 and QE2 was to drive yields higher, even though the Fed justified its efforts by asserting that Quantitative Easing would drive yields lower, and that in turn would stimulate the economy. Furthermore, this short history of aggressive Fed intervention provides no evidence whatsoever to support the notion that the Fed has artificially depressed Treasury yields. If anything, two rounds of QE only pushed rates up.
So why did massive bond purchases not only fail to drive bond prices higher and yields lower, but produce exactly the opposite of the Fed's intended result?

The short explanation is that QE1 and QE2 pushed yields higher because they were just what the markets and the world needed. The first two rounds of quantitative easing helped address deep-seated issues that were creating a scarcity of dollar liquidity, which in turn was holding back the economy and threatening deflation. Note in the chart above how QE1 and QE2 followed periods in which core inflation fell to very low levels—a sign of a shortage of money—and the Fed was very determined to avoid the threat of deflation. The demand for money was intense, and the Fed's aggressive provision of bank reserves satisfied that demand. (Bank reserves, since they now pay interest, are functionally equivalent in the eyes of banks to 3-mo. T-bills, universally regarded as the world's safest and most liquid asset.) Quantitative easing provided much-needed liquidity to the economy and to the markets, and it was a stronger economy and the reduced risk of deflation that in turn boosted yields.
But will QE3 work the same way? 10-yr yields are down almost 150 bps since the end of QE2. Some of that decline could be due to Operation Twist (which involved the sale of short-term Treasuries and the purchase of longer-term Treasuries), but I think it's more likely that yields have declined because economic growth has slowed. However, today core inflation is not unusually low, and inflation expectations, such as the 5-yr, 5-yr forward breakeven rate embedded in TIPS and Treasury prices, have been rising for most of the past year, currently standing at 2.75%.

Conditions today are quite different from what they were leading into QE1 and QE2. The economy is weak, as before, but this time the threat of deflation is quite remote. Swap spreads are very low and credit spreads are relatively low, which suggests that the economy is not suffering from a shortage of liquidity. Although gold and commodity prices are off their highs of last year, they are still way above the levels of 10 years ago, when deflation fears first surfaced, and far above the lows of late 2008 when deflation was a again a real threat. If anything, commodity prices have risen so much more than the general price level in the past 10 years that they are probably contributing to inflation.
So if the Fed proceeds with QE3 later this year, it won't be because the economy is suffering from a shortage of liquidity, or because deflation is a real threat. It will simply be because the Fed thinks—or hopes—that additional purchases of bonds will help strengthen the economy. Long-time readers of this blog will know that I don't believe that monetary stimulus can result in stronger growth. Monetary policy can remove barriers to growth, as we have seen with QE1 and QE2, but it can't create growth out of thin air. So if we do see a QE3, then this time I think its effects will be mainly to push inflation higher. And of course, higher inflation is very likely to drive bond yields higher.
So if we do get QE3, don't expect bond yields to decline—expect them to rise.

As the above chart of 10-yr Treasury yields shows, the bond market's enthusiasm for past episodes of quantitative easing was short-lived. The first phase of QE1 was announced Nov. 25, 2008, and it consisted of up to $100 billion in Agency securities and $500 billion of MBS. In the early stages of QE1, 10-yr yields declined almost 100 bps, but only for 5-6 weeks. (I think Fed purchases were overwhelmed by the widespread fears of a global financial collapse.) By late January, when the Fed announced the purchase of more Agency and MBS debt, and the expectation of the purchase of long-term Treasuries, yields had jumped back up. On March 18, 2009, the FOMC formally announced the expansion of the program to total $1.25 trillion of MBS and $300 billion of longer-term Treasuries. Despite these massive and unprecedented purchases, 10-yr Treasury yields marched steadily higher, and didn't peak until the end of QE1 in late March, 2010. Yes, that's right: yields rose until the time the Fed stopped purchasing bonds.
The idea of QE2 was first floated by Bernanke in late August 2010, when 10-yr yields were around 2.65%. By the time QE 2 became official, with the FOMC announcement of Novermber 3, 2010, 10-yr yields had fallen by a about 15 bps, to 2.5%. As QE 2 was implemented over the next six months, with the Fed purchasing an additional $600 billion of Treasuries, not only did yields fail to decline, they actually rose by 100 bps.
In short, the anticipation and the reality of two major rounds of Fed purchases of MBS and Treasuries only served to depress yields temporarily. The major impact of QE1 and QE2 was to drive yields higher, even though the Fed justified its efforts by asserting that Quantitative Easing would drive yields lower, and that in turn would stimulate the economy. Furthermore, this short history of aggressive Fed intervention provides no evidence whatsoever to support the notion that the Fed has artificially depressed Treasury yields. If anything, two rounds of QE only pushed rates up.
So why did massive bond purchases not only fail to drive bond prices higher and yields lower, but produce exactly the opposite of the Fed's intended result?
The short explanation is that QE1 and QE2 pushed yields higher because they were just what the markets and the world needed. The first two rounds of quantitative easing helped address deep-seated issues that were creating a scarcity of dollar liquidity, which in turn was holding back the economy and threatening deflation. Note in the chart above how QE1 and QE2 followed periods in which core inflation fell to very low levels—a sign of a shortage of money—and the Fed was very determined to avoid the threat of deflation. The demand for money was intense, and the Fed's aggressive provision of bank reserves satisfied that demand. (Bank reserves, since they now pay interest, are functionally equivalent in the eyes of banks to 3-mo. T-bills, universally regarded as the world's safest and most liquid asset.) Quantitative easing provided much-needed liquidity to the economy and to the markets, and it was a stronger economy and the reduced risk of deflation that in turn boosted yields.
But will QE3 work the same way? 10-yr yields are down almost 150 bps since the end of QE2. Some of that decline could be due to Operation Twist (which involved the sale of short-term Treasuries and the purchase of longer-term Treasuries), but I think it's more likely that yields have declined because economic growth has slowed. However, today core inflation is not unusually low, and inflation expectations, such as the 5-yr, 5-yr forward breakeven rate embedded in TIPS and Treasury prices, have been rising for most of the past year, currently standing at 2.75%.
Conditions today are quite different from what they were leading into QE1 and QE2. The economy is weak, as before, but this time the threat of deflation is quite remote. Swap spreads are very low and credit spreads are relatively low, which suggests that the economy is not suffering from a shortage of liquidity. Although gold and commodity prices are off their highs of last year, they are still way above the levels of 10 years ago, when deflation fears first surfaced, and far above the lows of late 2008 when deflation was a again a real threat. If anything, commodity prices have risen so much more than the general price level in the past 10 years that they are probably contributing to inflation.
So if the Fed proceeds with QE3 later this year, it won't be because the economy is suffering from a shortage of liquidity, or because deflation is a real threat. It will simply be because the Fed thinks—or hopes—that additional purchases of bonds will help strengthen the economy. Long-time readers of this blog will know that I don't believe that monetary stimulus can result in stronger growth. Monetary policy can remove barriers to growth, as we have seen with QE1 and QE2, but it can't create growth out of thin air. So if we do see a QE3, then this time I think its effects will be mainly to push inflation higher. And of course, higher inflation is very likely to drive bond yields higher.
So if we do get QE3, don't expect bond yields to decline—expect them to rise.
Senin, 20 Agustus 2012
Apple becomes the most valuable company of all time

My first post on the subject of Apple vs. Microsoft was in October '08, when I predicted that AAPL would surpass MSFT in market cap within a few years (AAPL was trading around 100 then). Well, they did that in mid-2010, and now they have achieved yet another milestone: Apple's market cap ($621 billion as of this writing) now exceeds Microsoft's all-time high, which at the time (late 1999) was the highest market cap ever achieved. Apple is now the most valuable company of all time. This has got to be the greatest David vs. Goliath corporate story of all time. The chart tells it all.
I have made numerous posts on Apple over the years, always of the bullish variety. I remain bullish on AAPL, but have cut the size of my position for reasons of prudence and diversification. Obviously, AAPL can't continue to post such outsized gains forever. But I don't see why it can't continue to grow, especially since Apple's share of the PC market is still relatively small. Morever, although Apple has a very healthy share of the global smartphone market, smartphones still represent only a relatively small share of the global mobile phone market. There is lots of room to grow, and Apple still has the best products in its class and can still claim the mantle of world's most innovative company. New products are in the pipeline and it will be very exciting to see whether and how Apple can revolutionize TV as we know it.
I'm looking forward to upgrading to an iPhone 5 next month, and will be receiving a new MacBook Pro with Retina Display later this week.
Jumat, 17 Agustus 2012
No shortage of money


M2, arguably the best measure of the amount of readily/easily spendable cash in the economy, has now surpassed the $10 trillion mark, a milestone of sorts. M2 has grown about 6% per year on average for a very long time, but over the past year it's grown at a 7.7% annualized rate. That's not exactly what you would expect from what many consider to be the Fed's massive money-printing operations. It's hardly enough to wreak inflationary havoc in the economy. As the second chart suggests, this extra growth probably reflects some capital flight out of the Eurozone.


For all the talk of capital fleeing the Eurozone, their measure of the M2 money supply has not declined at all; it has grown at a 2.8% annualized pace for the past two years. As the chart above suggests, the extra money accumulated in the Eurozone in the years leading up to 2008—when the Eurozone was considered to be more attractive than the U.S.—has now largely been reversed. In any event, Eurozone M2 has grown by about the same rate as U.S. M2 over the long haul. Perhaps it's not a coincidence that inflation in the Eurozone has been substantially similar to that in the U.S.

One source of the increased amount of M2 money is Commercial & Industrial Loans, which have increased by almost $270 billion in the past two years, and are currently growing at strong, double-digit rates. This is good evidence that banks are relaxing their lending standards and that businesses are more willing to borrow, both signs of increased confidence and thus a portent of stronger growth to come.
On balance, it's hard to find anything scary in these charts. Money is not in scarce supply, and indeed it is probably just sufficient to satisfy the demand for money. If there is something to worry about, it is the mountain of bank reserves that sit idle at the Fed, some $1.5 trillion worth. To judge from the relatively tame inflation rate and the strong demand for money, the world's demand for idle bank reserves is strong, and so the Fed's creation of those reserves was apparently what was needed to restore needed liquidity to the system. We are in a sort of equilibrium for now, but that could change if the demand for safe dollar liquidity should decline. If the savers start spending the cash they have stuffed into bank deposits, and if banks start using their idle reserves to make new loans, then we could see a tsunami of money introduced to the system which would likely boost nominal GDP by a substantial amount. The biggest monetary risk we face is not knowing whether the Fed would be able to reverse its massive creation of bank reserves in a timely fashion should money demand fall, in order to prevent a significant surge in inflation.
Kamis, 16 Agustus 2012
Reminder: the world is not coming to an end


These charts serve as a reminder that no matter how much angst there is out there about an imminent U.S. recession, a Eurozone collapse, or a China implosion, key financial indicators currently are trading at relatively benign levels, even as valuations (e.g. PE ratios) remain depressed. Swap spreads in the U.S. are about as low as they get, suggesting that systemic risk is also very low and the outlook for the economy is for things to improve. Eurozone swap spreads are still somewhat elevated, but they have been moving down all year long, and that also suggests that things are more likely to improve in Europe than deteriorate. The implied volatility of equity options is very close to a multi-year low, suggesting that although investors believe that corporate profits will decline (as evidenced by relatively low PE ratios), they are reasonably comfortable that nothing serious is going to happen.
In short, even though the future doesn't look bright (yet), it's very unlikely that the world we know it is about to end.
Labor market fundamentals continue to improve

Now that all the seasonal noise has been washed out of the data, unemployment claims turn out to have been bumping along a bottom of roughly 360K per week for most of this year, and the most recent datapoint is down about 10% from a year ago. We still have modest improvement going on here, but perhaps more importantly, absolutely no sign of any labor market deterioration, especially of the type that presages recessions.

Meanwhile, the number of people receiving unemployment insurance continues to decline, and is down almost 17% over the past year. That's 1.1 million fewer people receiving checks for not working in just the past year. Some of them have undoubtedly gotten new jobs, and some of them are undoubtedly looking for a new job with new-found intensity. Others are not happy at all. Businesses, for their part, do not seem to sense any deterioration in their markets. All of this is an important change on the margin that affects the economy in many small ways, most of them good.
Still more evidence of a housing recovery


July housing starts were a bit lower than expected (746K vs. 756K), but building permits—which naturally come before starts—were higher than expected (812K vs. 769K). But all it takes is a quick glance at these charts of each series to know that residential construction is well into a significant recovery. To be sure, starts and permits today are only up to the worst levels ever seen prior to the Great Recession, but look how far they've come: starts are up 44% from last year's lows, and permits are up 58% from their recession lows. That's a huge recovery on the margin.

Home builders are definitely seeing an improvement in the housing market fundamentals, and they are responding accordingly. These folks are a lot closer to the action than you and I, and they are making some serious commitments. The housing market is looking better and better, and with confidence still quite low, there is still lots of room for improvement.
Rabu, 15 Agustus 2012
The bond/equity disconnect resolves in favor of equities
Last week I noted the significant disconnect between rising equity prices and very low and falling bond yields. Low bond yields are symptomatic of dismal economic growth expectations, but rising equity prices point to improving expectations. One explanation for this disconnect that I offered was that equities are not necessarily pointing to a strong economy, but rather to an economy that is now seen to be less weak than it appeared to be a month ago. Bond yields remained low, I suggested, because the outlook for the economy is still weak enough to warrant extremely low short-term interest rates for at least the next several years, much as the Fed has been telegraphing.

This week the disconnect between the two markets seems to be resolving in favor of equities. 30-yr Treasury yields are up sharply—nearly 50 bps—in the past three weeks, with most of that rise occurring in the past 12 days. Meanwhile, 2-yr Treasury yields are up less than 10 bps, which suggests that the market has not made any major adjustments in its expectations for near-term Fed tightening. (2-yr Treasuries can be thought of as the market's expected average Fed funds rate over the next 2 years.) Most of the action in recent weeks has come at the long end of the curve—from 10 to 30 year—which is consistent with my theory that the outlook for the economy has become less dire, and so the risk of deflation has been reduced considerably (the bond market typically views a very weak economy as posing deflation risk). But the economy has not improved enough to warrant any major change in the outlook for Fed policy. I'll stick with my view that equities are rallying not because the economic outlook is becoming healthy, but rather because it is becoming less awful—don't forget the drumbeat of expectations calling for the economy to now be in recession. This is still a reluctant rally.
This week the disconnect between the two markets seems to be resolving in favor of equities. 30-yr Treasury yields are up sharply—nearly 50 bps—in the past three weeks, with most of that rise occurring in the past 12 days. Meanwhile, 2-yr Treasury yields are up less than 10 bps, which suggests that the market has not made any major adjustments in its expectations for near-term Fed tightening. (2-yr Treasuries can be thought of as the market's expected average Fed funds rate over the next 2 years.) Most of the action in recent weeks has come at the long end of the curve—from 10 to 30 year—which is consistent with my theory that the outlook for the economy has become less dire, and so the risk of deflation has been reduced considerably (the bond market typically views a very weak economy as posing deflation risk). But the economy has not improved enough to warrant any major change in the outlook for Fed policy. I'll stick with my view that equities are rallying not because the economic outlook is becoming healthy, but rather because it is becoming less awful—don't forget the drumbeat of expectations calling for the economy to now be in recession. This is still a reluctant rally.
Inflation is tame, no need for more QE

The CPI was unchanged in July, has actually fallen at a -0.8% annualized rate over the past three months, and is up at an annualized rate of only 1.1% in the past six months. However, virtually all the weakness in the headline CPI comes from declining energy prices. As the chart above shows, the Core CPI is up at a 2.2% annualized pace over the past six months.


As the charts above show, energy prices are on the rise again, so the weakness in the headline CPI we have seen has already run its course. Gasoline prices at the pump are up over 10% in the past month, and crude oil prices are up almost 20%. It's best, therefore, to just look at the core CPI as the better measure of inflation for now.

The current rate of increase in core inflation is only slightly less than the increase in overall CPI inflation has been, on average, over the past 15 years. While it's certainly good that inflation is not higher, the best that can be said is that it has been averaging just above the Fed's target for quite some time. As the first chart in this post shows, the Fed was moved to engage in quantitative easing only when the core CPI threatened to enter deflationary territory. That is not the case today, and given the ongoing strength in industrial production and the ongoing increase in jobs, the Fed would have a very hard time justifying more QE at this time. The economy is struggling, but that's not a reason for more monetary stimulus.

In fact, as this next chart suggests, the Fed has been very accommodative for a long time, and may be overstaying its welcome in accommodative territory. This chart compares the level of capacity utilization, a proxy for the economy's idle capacity, to the real Fed funds rate, the best measure of how easy or tight monetary policy actually is. When capacity utilization rises, signaling declining idle capacity and increasing supply constraints, the Fed almost always tightens policy. When capacity utilization declines, the Fed almost always eases policy. Today the gap between the relatively high level of capacity utilization and the very low level of the real Fed funds rate is rather big and growing. The risk of the Fed remaining "too easy for too long" is rising. The market is sensing this, and it shows up in forward-looking inflation expectations, particularly in the 5-yr, 5-yr forward breakeven inflation embedded in TIPS and Treasury prices: over the past 11 months, this measure of inflation expectations (the Fed's favorite, in fact) is up from 2.0% to 2.7%.
Despite the relative tranquility of consumer price inflation, there is little if anything in the inflation and economic data that would justify further quantitative easing. Increasingly, it's looking like the Fed's next move will be a tightening, not another easing.
Industrial production remains healthy

Industrial production still shows no sign whatsoever of a recession. Production is up 4.4% over the past year, and it has risen at a 3% annualized pace in the past six months.

Manufacturing production, which strips out utility output from the total, looks healthy also, having risen 5.1% in the past year, and up at an annualized pace of 2.6% in the past six months.

Production of business equipment continues to be very strong, up 12.4% in the past year, and rising at an annualized pace of 10.3% in the past six months. This measure of industrial output has now clearly exceeded its pre-recession high. Remember the V-shaped recovery? It's been long forgotten, but not when it comes to business equipment.
The July industrial production numbers all but rule out the recession that many have been looking for. The economy went through a bit of a soft patch in the first half of this year, but now looks to be picking up. The folks at ECRI have a lot more 'splainin to do.
Senin, 13 Agustus 2012
What if something goes right?
Smart investors always keep a sharp eye out for what might go wrong, and they build their portfolios accordingly, by not putting all their eggs in one basket.
Today, there are all sorts of things that might go wrong, and there is plenty of bad news to be found everywhere you look. Investors are right to be very worried.


In fact, sovereign bond markets are proof that investors everywhere are extremely concerned, because yields on most sovereign debt are extremely low. 10-yr Treasury yields are a paltry 1.6%; German 10-yr yields are 1.4%; and Japanese 10-yr yields are a mere 0.8%. It's simply amazing that 2-yr German and Swiss yields are now negative. You only buy bonds with extremely low yields like these if you are terribly worried about the risks of other investments. Bottom line, markets everywhere are beset by predictions of doom and gloom.
That's because it's no secret that the Eurozone is in a recession, and that some Eurozone countries seem utterly incapable of coming to terms with their bloated public sector spending, and so the risk of major sovereign debt defaults remains relatively high. It's because the whole world has seen China's economy slow meaningfully, and we know that many developing economies are struggling. Who is unaware that almost every major central bank in the world is up against the "zero boundary," unable to stimulate further by reducing interest rates, and therefore forced to resort to quantitative easing which could potentially threaten a big increase in inflation if not reversed in timely fashion? Iran is getting close to having atomic weapons, and Israel is not the only country worried about the consequences.
Everyone knows that the U.S. unemployment rate, which is still very high at 8.3%, nevertheless severely understates the effective unemployment rate, which is much higher. Nearly everyone bemoans the fact that the U.S. economy has been growing at a very slow rate ever since the recovery started, and that this is the most miserable recovery in our lifetimes.
Pundits remind us every day that there are millions of homeowners who are underwater with their mortgages, and that banks are still holding millions of foreclosed properties (REO) on their balance sheets; thus the "shadow inventory" of properties that could get dumped on the market is huge, and prices could suffer another collapse. So it's no wonder that mortgage rates are extremely low—it's because there is a relative shortage of people willing to borrow to buy homes, even though homes are more affordable now then ever before.


The stock market is studiously ignoring today's extremely strong level of corporate profits, focusing instead on how much profits are likely to decline, which is why PE ratios are below average.
Meanwhile, the U.S. government continues to run trillion-dollar deficits, while the unfunded obligations of social security and medicare are staggeringly large. It's dismaying that there don't seem to be any politicians—with the exception of that right-wing whacko Paul Ryan—willing or able to tackle this challenge. And of course, the "fiscal cliff" looms at year end.


In short, if you don't know that the world is beset with problems and threats of mega proportions, then you just haven't been paying attention. And if you have been paying attention, you're extremely worried about all the things that could wrong, and it's a good bet that your portfolio is extremely conservative. The charts above tell the story: for the past three years, investors have been pulling money out of equity funds and stuffing it into the relatively safety of bond funds, despite the ongoing rise in equity prices. Markets everywhere are depressed because of all the concerns over all the things that might go wrong. Forecasts for future growth range from a depression to, at best, 2.5-3% real growth. Contrarians take note: no one is forecasting growth in excess of 3-4%.
Ok, fine, lots of things could go wrong, but what if something goes right? That, I would submit, is the key risk you face today. Is your portfolio positioned to take advantage of an economy that continues to grow? of a housing market that doesn't collapse again, and in which prices begin to recover, albeit modestly? of corporate profits that fail to collapse?

Markets have actually been grappling with these sorts of questions for some time now. As the chart above shows, equities appear to be rising reluctantly, because the economic fundamentals (using first-time claims for unemployment as a proxy) continue to improve instead of deteriorating. When markets are braced for the worst, if the worst doesn't happen, then prices almost have to rise.


Eurozone swap spreads have improved significantly this year, and 5-yr credit default swaps have declined substantially. Both developments suggest that the risk of a Eurozone collapse has declined meaningfully. Not surprisingly, Eurozone equity markets are up over 16% in the past two months. Not because the future is looking brighter, but because the future is looking less grim.
If just a few things go right, then it is likely that risk assets (in particular equities, real estate, and commodities) could continue to rise in price. And economies could do a little better than expected, even if sovereign yields rise. Indeed, rising sovereign yields would be a sure sign of an improved outlook.
Whereas owning sovereign debt has traditionally been a good way to hedge against the risk of something going wrong with the economy, these days you should consider that being short sovereign debt (or just not holding any, or borrowing at fixed rates) is a good way to hedge against the risk of something going right.
Langganan:
Postingan (Atom)